 As market researchers, we ask consumers how they perceive brands and products, and we accept their responses as a reflection of how they think and feel. But, how do we know that consumers are expressing their honest feelings about a brand? And, is there a way to test whether consumers’ expressed attitudes represent their true thoughts and feelings?
For decades, psychologists have been grappling with this question and have tried to measure implicit thinking (i.e., responses made automatically, without conscious control) to see if that differs from explicit thinking (i.e., responses made based on critical thinking, that may be conditioned by social norms, personal ideals, or expectations).
One popular method of measuring implicit thoughts is the Implicit Association Test (IAT) developed at Harvard University1, which has been used to detect prejudices toward specific genders, races, ages, political groups, etc. The underlying theory is that people will respond more quickly to words or concepts that are aligned with their true prejudices and that reaction times will provide insight into what people really believe. For example, researchers have identified that people who are prejudiced toward African Americans have faster reaction times to negative words that are paired with this race. This result has been replicated across numerous groups2.
Applying IAT to Market Research
At Beall Research, we wondered if the IAT could be used in market research, so we designed a quantitative study to test whether implicit thoughts toward brands are different than explicitly stated ones.
We developed a questionnaire to measure perceptions of nine well-known brands in the US. Brands were selected to represent a wide variety of categories. These brands were in the technology, durables, energy, beverage, online gaming, apparel, tobacco, and fast food categories. The 1,637 respondents in this study were representative of the US population.
To measure explicit attitudes, respondents rated brands familiar to them on four different brand affinity measures, using a ten-point scale:
- How do you feel about [BRAND]? (1=I hate this brand, 10=I love this brand)
- How important is [BRAND] to you? (1=Not at all important, 10=Extremely important)
- How likely are you to recommend [BRAND] to family or friends? (1=Not at all likely, 10=Extremely likely)
- How well does "For people like me" describe [BRAND]? (1=Does not describe at all, 10=Describes completely)
We also used a version of the IAT, which paired brands with positive and negative words. The specific methodology is described in detail at the end of this paper.
Analysis of Results
To compare the results from the implicit and explicit measures, we conducted several analyses:
- Calculated and compared the relative rankings of the brands using the IAT and direct ratings
- Calculated the correlations between the rankings based on the IAT and direct ratings
- Calculated the correlations between mean IAT scores and direct ratings
Below are the relative rankings of the brands based on the IAT and direct ratings. The implicit and explicit measures produce similar rankings. At the bottom of the table are the correlations between the rankings based on the IAT scores and direct ratings, which are quite high, indicating alignment in the results of the two methods.
Brand rankings and correlations between implicit (IAT) and explicit (ratings) measures
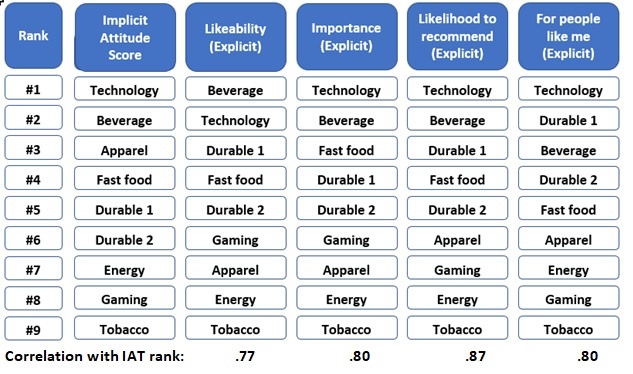
In this group of brands, the apparel brand is the biggest outlier; it is viewed more favorably implicitly than explicitly. This anomaly may be because consumers like the brand more than they are willing to say they do, or they think it’s a good brand, but it’s just not their style. Overall, however, the high degree of correlation suggests that the implicit and explicit measures are reflecting the same attitudes toward the brands.
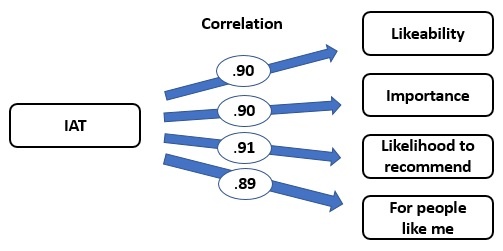
These relationships are confirmed when we compare the mean scores, as shown below. The correlations between the mean IAT scores and mean explicit ratings are very strong, which indicates that respondents are answering the IAT exercise and rating questions similarly.
Correlations between implicit (IAT) and explicit (ratings) mean scores across brands
Conclusions
We adapted the IAT to measure consumers’ underlying attitudes toward several brands, and compared the results from that method to more traditional, explicit ratings of these brands. The goal of this analysis was to determine whether consumers’ implicit attitudes toward brands reveal biases or prejudices that aren’t measured with direct ratings.
The strong agreement between the IAT scores and the brand affinity measures indicates that consumers are willing to express their true attitudes and prejudices toward brands and that the IAT does not reveal anything more than what consumers already provided via their explicit evaluations that were expressed through numeric ratings. Brands that are broadly used and/or respected rank higher, and brands that are more controversial rank lower both in implicit and explicit measures. Therefore, we found that more traditional, explicit methods of evaluating brands are capturing consumers’ honest attitudes about brands. The IAT does not provide any great additional insight into consumers’ attitudes and beliefs about major consumer brands.
How the IAT Works
The IAT is administered online, as follows:
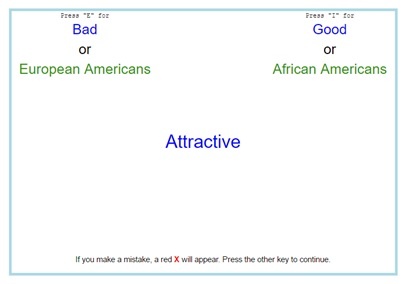
- A pair of words appear in each upper corner of the screen (see example below). One word in each pair is the group for which prejudice is being tested (e.g., European Americans v. African Americans, Men v. Women, etc.). The second word in each pair is a measure of affinity (e.g., Good v. Bad, Positive v. Negative, etc.).
- Then, in a succession of screens, a positive affinity word (e.g., happy, love, attractive, etc.), negative affinity word (e.g., selfish, ugly, hate, etc.), or an image representing one of the groups (e.g., person of a particular race, gender, etc.) appears in the center of the screen, and the respondent presses one key if the stimulus corresponds with one of the words in the upper right of the screen, and another key if the stimulus corresponds with one of the words in the upper left of the screen.
- Midway through this test, the affinity measure is switched so that it is matched with the other group, and the exercise is repeated.
In each screen, the time it takes the respondent from exposure to the word/image to pressing the correct key is recorded. If a respondent mismatches the word/image, an error message is shown and the timer continues until the respondent matches the word/image correctly.
The result is that a person who is prejudiced against a particular group will respond more quickly to the combination of that group with negative words than with positive words. A person’s implicit attitudes toward each group is measured, both directionally (positive or negative) and in strength. The IAT’s validity has been demonstrated repeatedly in social science experiments 3,4,5. Thus, social scientists have learned that the IAT is effective at identifying a person’s prejudices, even when the person is unwilling to admit to those prejudices openly.
How We Used the IAT for This Research
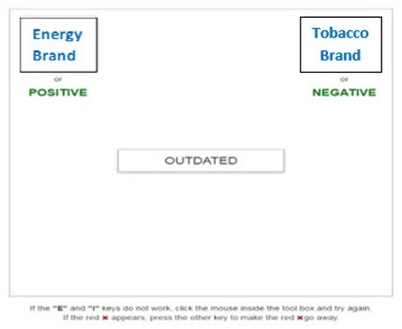
In our IAT exercise, respondents were shown several screens (like the one below) with two brands randomly paired with the words “Positive” and “Negative,” and asked to match a series of positive words (e.g., trustworthy, innovative, high quality, etc.) and negative words (e.g., untrustworthy, outdated, low quality, etc.) with one of the brand and word pairs in the upper corners of the screen. The words “Positive” and “Negative” were then switched, so that whichever brand had initially been paired with “Positive” was then paired with “Negative” and vice-versa, and the exercise repeated. Scores based on the response times in the two exercises were calculated for each brand6.
References
- Greenwald, Anthony G.; McGhee, Debbie E.; Schwartz, Jordan L.K. (1998), "Measuring Individual Differences in Implicit Cognition: The Implicit Association Test", Journal of Personality and Social Psychology
- Greenwald, A. G., Poehlman, T. A., Uhlmann, E., & Banaji, M. R. (2009). Understanding and using the Implicit Association Test: III. Meta-analysis of predictive validity. Journal of Personality and Social Psychology, 97, 17–41
- Maison, Dominika; Greenwald, Anthony G.; Bruin, Ralph H., “Predictive Validity of the Implicit Association Test in Studies of Brands, Consumer Attitudes, and Behavior”, Journal of Consumer Psychology
- Cunningham, William A.; Preacher, Kristopher J.; Banaji, Mahzarin R., “Implicit Attitude Measures: Consistency, Stability, and Convergent Validity”, Psychological Science
- Gawronski, Bertram, “What Does the Implicit Association Test Measure? A Test of the Convergent and Discriminant Validity of Prejudice-Related IAT’s”, Experimental Psychololgy
- Latencies (i.e., time required for a correct answer) were used to calculate D scores by subtracting the mean latencies of the brand as positive from the latencies of the brand as negative, divided by the standard deviation of scores across both exercises: D = (M2 – M1) / SD. D scores range from +2.0 as the extreme positive evaluation to -2.0 for the extreme negative.

About Beall Research, Inc.
Beall is a boutique firm specializing in both qualitative and quantitative strategic market research. At Beall, we don’t just gather data; we use market research to answer the strategic questions that drive business decisions. We look at the world differently than most market researchers because we are psychologists, anthropologists, historians, economists, mathematicians, and sociologists. And we use theoretical backgrounds to frame insights that help solve real-world problems. As a result, we design and analyze research studies differently. Our insights drive major changes for organizations.