
How do country-specific tariff rates impact different segments of the US manufacturing sector?
This question has manufacturers scrambling as trade policy shifts ripple through global supply chains.

How do country-specific tariff rates impact different segments of the US manufacturing sector?
This question has manufacturers scrambling as trade policy shifts ripple through global supply chains.
Joe Newsum on July 28, 2023

Understanding the performance of a company is always at the top of mind for leaders and consultants. While internal analysis of the company’s financials and data can be insightful, it can also be somewhat baseless without comparison to industry peers. It is always prudent to couple internal analysis with external benchmarking.
Joe Newsum on August 28, 2019
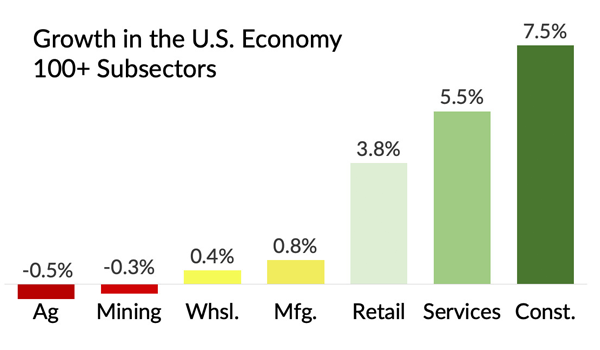
In 2018, the U.S. business economy was $37 trillion, representing the total revenue generated by private companies (including intermediate products, which aren’t included in GDP figures). Over the past 5 years, the U.S. business economy has grown 3.2% annually for a total growth of $5.4 trillion. Yet, growth has been very uneven across sectors.
Joe Newsum on August 12, 2019
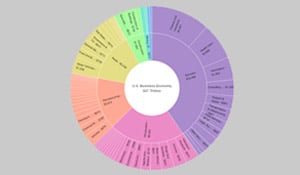
Check out a fascinating interactive chart of the entire U.S. business economy by Kentley Insights. The chart includes the total revenue generated by the 1,000+ industries of the U.S. business economy. Click on a section to get into the industry specifics and then on the center of the circle to get back out.