 Understanding the performance of a company is always at the top of mind for leaders and consultants. While internal analysis of the company’s financials and data can be insightful, it can also be somewhat baseless without comparison to industry peers. It is always prudent to couple internal analysis with external benchmarking.
But, where do you start?
Working with clients trying to determine their performance and identify improvement opportunities, I always start with the top seven strategic benchmarks:
1. Revenue Growth
2. Profitability
3. Product Line Breakdown & Growth
4. Productivity – Revenue per Employee
5. Workforce Composition
6. Operating Cost Breakdown
7. Balance Sheet Breakdown
1. Revenue Growth – Is the Customer Value Proposition Working?
The revenue growth of a company determines the overall health of the company’s customer value proposition. The goal of growth strategy is to drive better value for customers than competitors, and the output of achieving this is revenue growth that outpaces the industry.
While benchmarking revenue growth seems straightforward, there is a nuance to this benchmarking that is often overlooked. Benchmarking a company’s revenue growth to the industry can be misleading, since the growth or decline of the total number of companies (firms) and establishments (e.g., stores, locations, offices) in an industry can skew overall industry revenue growth.
When benchmarking revenue growth of a company, make sure you benchmark it against the revenue growth per company and location of the industry. In the below example of the same industry, you can see the difference in growth between industry revenue, industry revenue per company, and industry revenue per location.
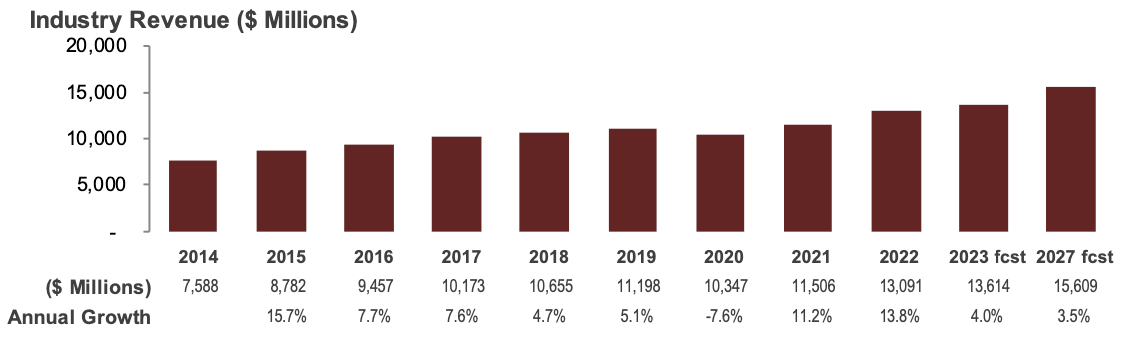
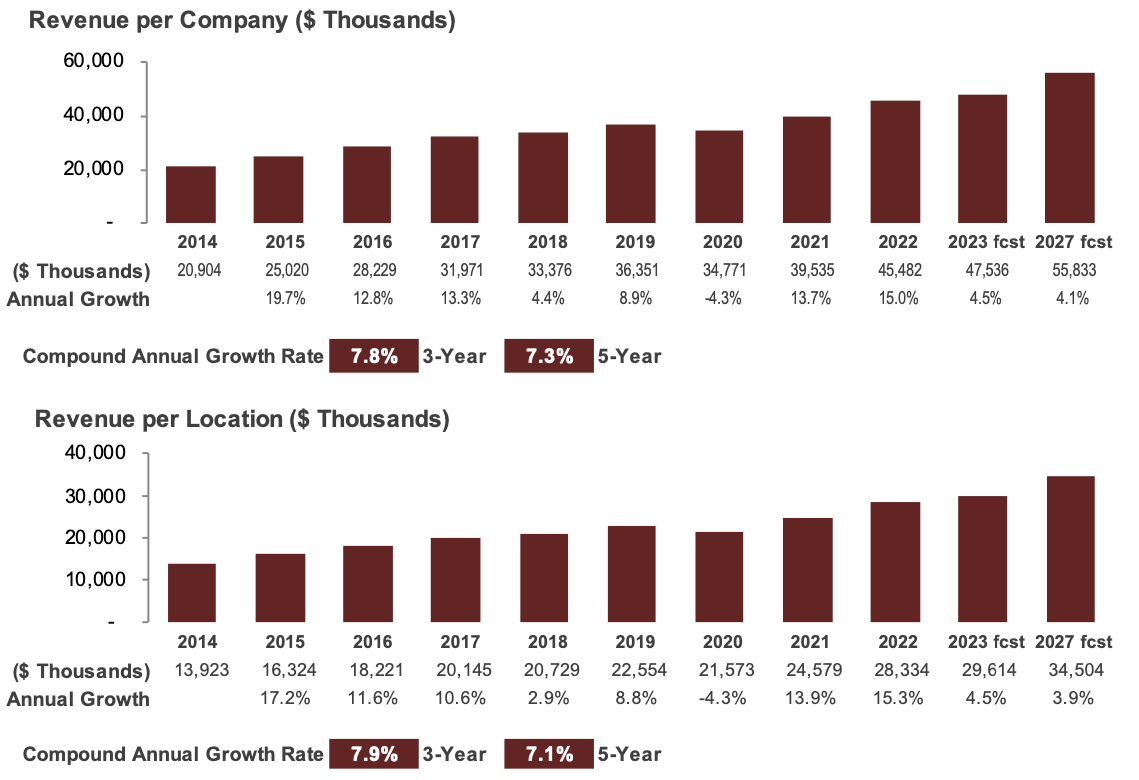
In this example, just benchmarking a company’s revenue growth to the industry revenue growth could be very misleading, given there is substantial consolidation in companies and locations.
2. Profitability – The Bottom Line
If a company is growing faster than the industry, then the company may be on the right strategic path, but then the question is, “Is the company growing in a financially superior way than the competition?”
Answering this question brings us to benchmarking the profitability of a company to the competitors in the industry. With the right data, this benchmarking is fairly straightforward.
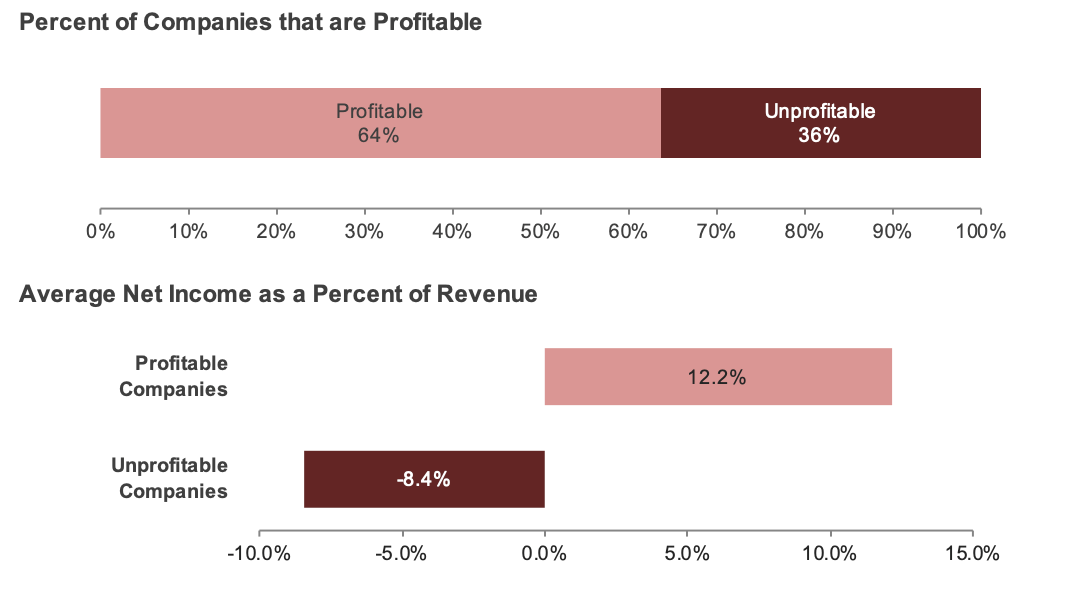
Yet, once again, there is a slight nuance that needs to be addressed, which is to ensure you benchmark profitability to those companies in an industry that are profitable. If you look at the below example of an industry, the total industry profit would be slightly negative. If you look at the below example of an industry, the total industry net income would average 4.7% (64%*12.2% + 36%*-8.4%). If you were to benchmark a company that had 5% net income to revenue to the industry, then the conclusion would be the company is in line with the industry. But, then if you benchmarked the same company to the 12.2% net profit margin of those companies in the industry that were profitable, the conclusion would be the company is underperforming profitable peers.
3. Product Line Breakdown & Growth – The Low-Hanging Fruit to Growth
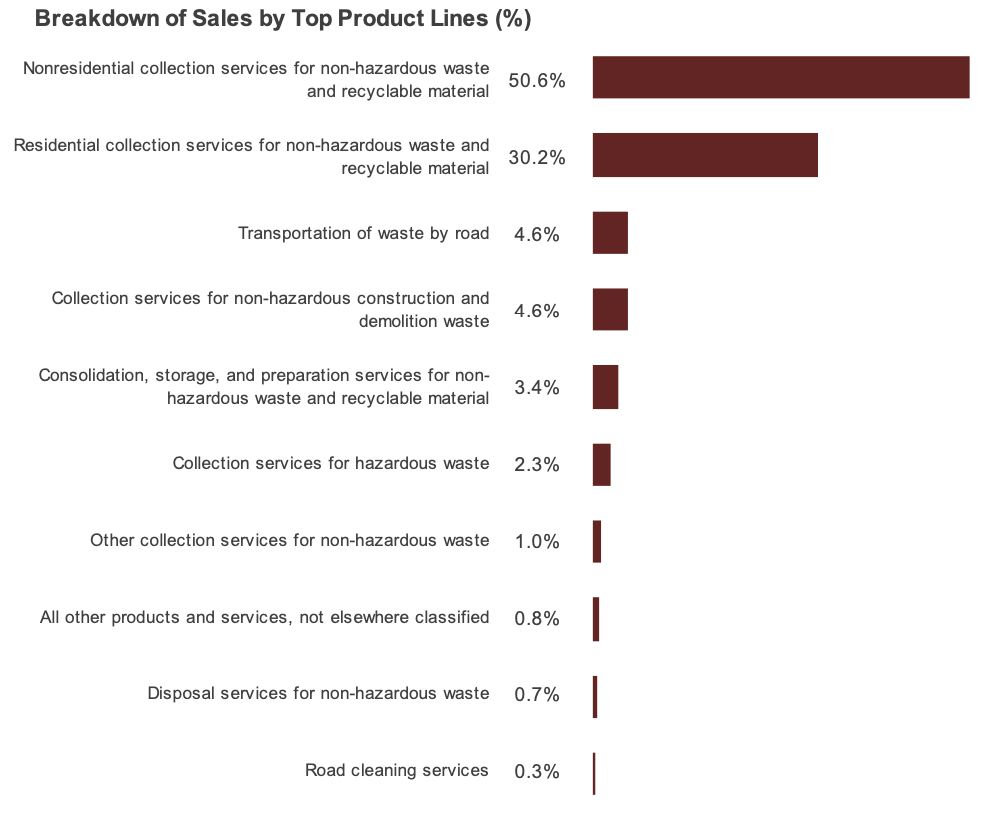
When it comes to growth strategy, it is critical to understand how a company’s product line penetration and growth stacks up against the competition. Product line penetration benchmarking necessitates organizing product or service lines in segments and calculating the percent make-up of total revenues. When conducting this analysis, it always goes smoother if you first have the industry benchmarks, so you can more efficiently segment the company’s product and service lines to correspond with the benchmarks. Below is an example of the product line breakdown for the Waste Collection industry.
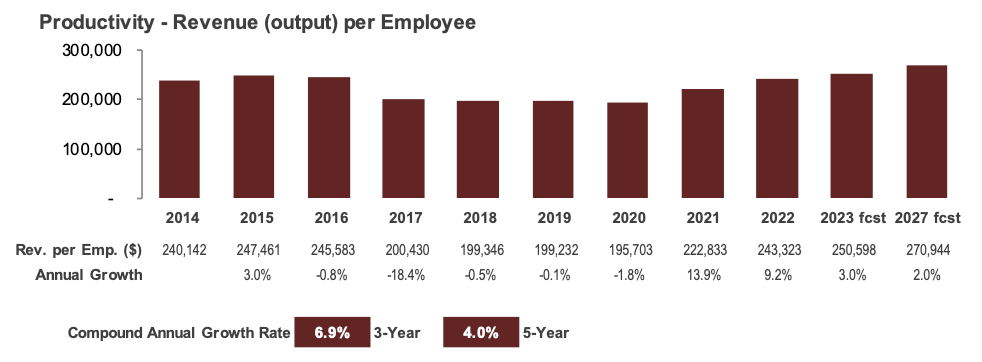
4. Productivity – Revenue per Employee – Do I Have the Right Number of People?
One of the most frequent questions that comes up with management teams is, “Do I have the right number of people?” While there is often a bit of frustration when asked, it is one of the easier questions to answer through some simple productivity (i.e., revenue per employee) benchmarking.
The below productivity benchmark gives a historical perspective and forecast on productivity. Simply comparing your company's revenue per employee against the industry is typically eye-opening and can help you in headcount planning or in the event of a headcount reduction. I’ve often come across companies that want to know why they are unprofitable, and once they see their productivity benchmark analysis, the answer becomes crystal clear.
5. Workforce Composition
Let’s say productivity for a company lags that of the industry … then what?
The next step is to understand if you have the right people in the right roles and positions. The first benchmarking analysis to begin with is span of control, which is the ratio of individual contributors to each manager in a company. In the table below, management represents 12.5% of the industry, which equates to a span of control of ~7 (87.5% non-managers / 12.5% managers). Typically, a span of control of 7-10 is ideal, but it could be 15-20 for more production, retail, and some service industries. The key to the analysis is to segment the managers in an organization with only 2-5 direct reports, and then understand the drivers of the low span of control.
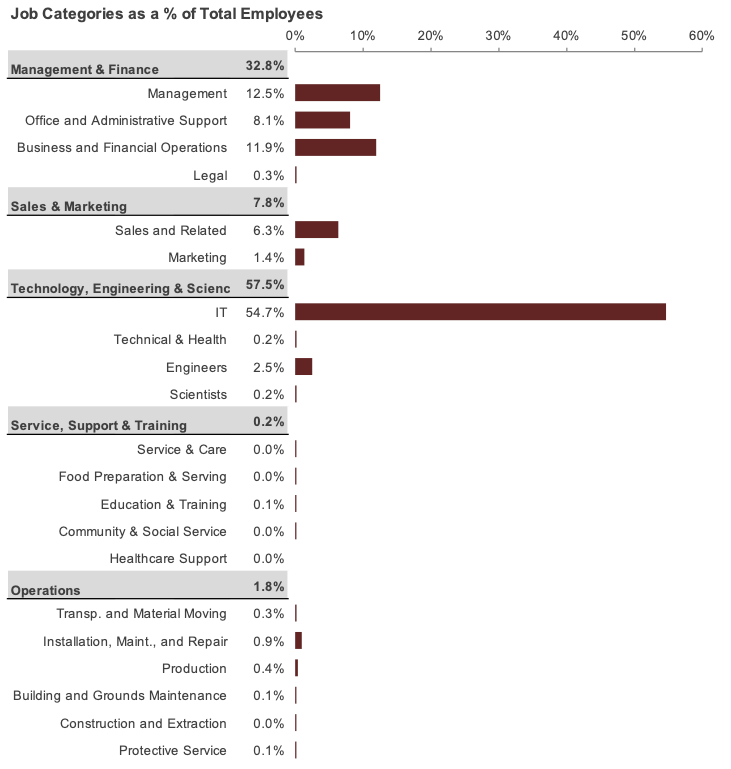
Of course, benchmarking the functional roles of the entire company to the industry can be very informative. I typically really scrutinize administrative, financial, and legal roles, since those are often overhead and should be as lean as possible in most organizations.
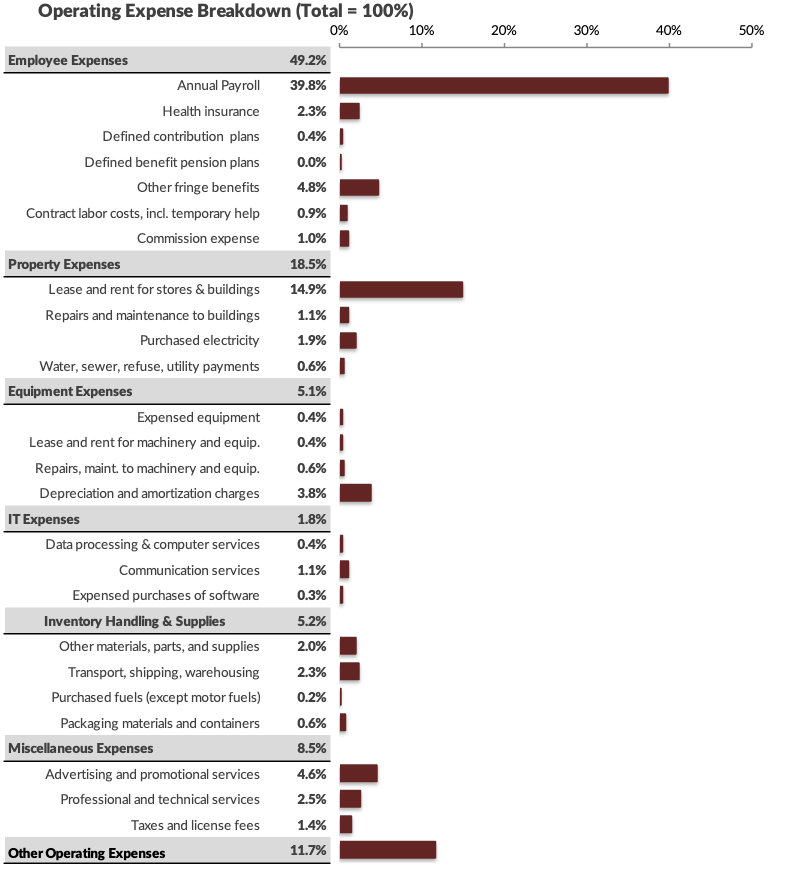
6. Operating Expense Breakdown – Opening Eyes to Improvement Opportunities
Digging into the cost structure of a company always reveals insights and opportunities. While the benchmarking analysis is typically straightforward, it usually takes the most time, given the mapping of a company’s general ledger categories to the benchmarking categories. But, once the analysis is complete, it is often eye-opening to management teams, and can lead to short-term and long-term improvement efforts to lean out some parts of operation to re-invest in those under-funded areas. Below is an example of an industry’s operating expense breakdown.
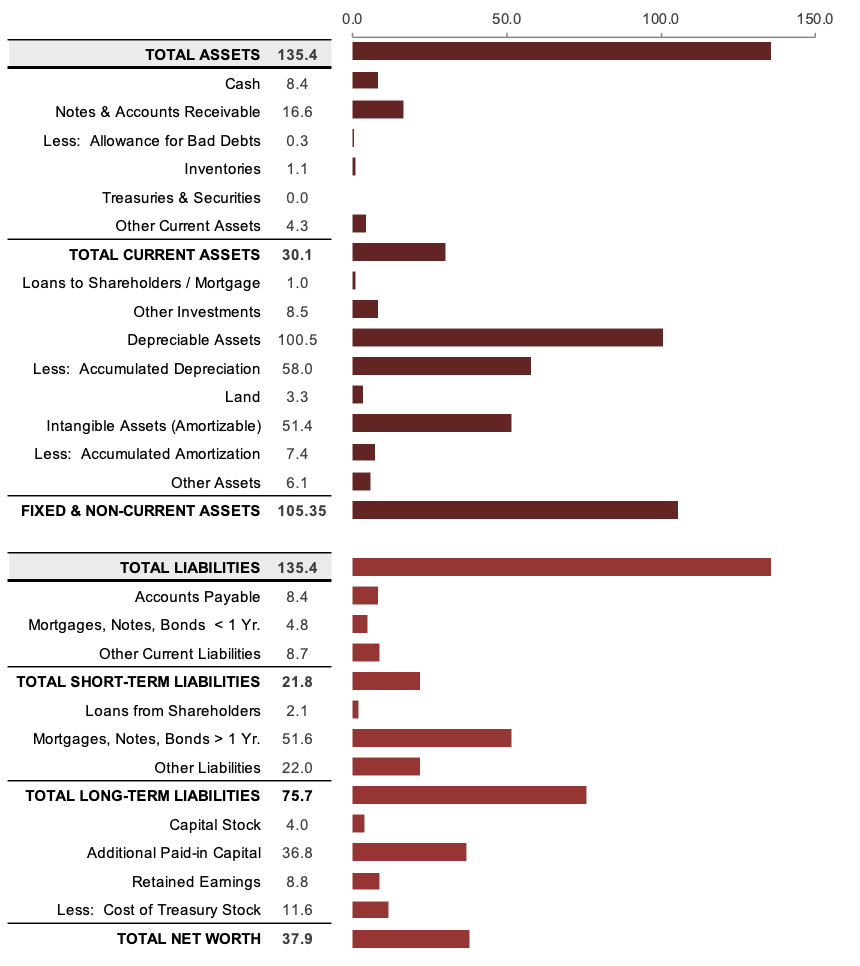
7. Balance Sheet Breakdown - Improving Capital Structure
As capital is getting more expensive, it's important to optimize your capital structure to free up cash. Below are balance sheet benchmarks indexed to total revenue at 100. How do you compare to industry peers when it comes to account receivables, inventory, accounts payables, cash, and more? To compare, you have to take your current balance sheet and divide it by your annual revenue to derive metrics you can compare to. Another way to understand certain metrics such as accounts receivable or payables is to divide let's say AR by (100/365) or the revenue index (100) divided by 365 days, which below would be 16.6/(100/365) = 60.6 days of AR, which means the industry typically takes 60.6 days to get paid. While on the flip side, the industry averages 8.4/(100/365) = 30.7 days to pay accounts payable.
Get Started
A strategic benchmarking project can create a robust fact base for identifying, exploring, and sizing strategic opportunities for any company. And, getting started doesn’t have to be a daunting task. Beginning with the top seven benchmarks will ensure quick and impactful strategic insights to build upon.
About Kentley Insights
Kentley Insights, a partner of MarketResearch.com, publishes Insights & Benchmarking Reports on more than 1,000 industries. The top seven strategic benchmarks are included in each report, along with 100+ other revenue, cost, financial, and organizational competitive benchmarks. You can access these concise, data-rich reports at an affordable price point. Find your industry now, and search the full collection of competitive benchmarking reports by Kentley Insights to uncover valuable new insights.
About the Author
Joe Newsum is a strategy and benchmarking expert, with over 20 years of experience supporting companies in developing and executing strategy. As CEO of Kentley Insights, Joe leads his team in providing companies with insightful industry and market data. Previously, Joe was a strategy consultant at McKinsey & Company and Mercer Management Consulting. He has an MBA from the Tuck School of Business at Dartmouth and a B.S. from Stanford University.