 In the B2B world, market share is pursued and defended constantly. On a customer-by-customer basis, companies constantly exploit opportunities to take share from competitors and develop strategies to prevent losing share. Sustainable growth is dependent on developing solid strategies in both of these areas. So how do you begin to understand all of the market dynamics associated with developing a comprehensive strategy designed to protect and grow market share?
Our recommendation is to concentrate on understanding these critical aspects of value:
- What value are you delivering to your customers?
- Are you performing well on the most important drivers of value?
- How are you positioned against competition in general and head-to-head against specific competitors?
- What are the drivers of value within your market?
Drivers of Value
Let’s look at how customers understand and derive value in this complex B2B world. When people think about value, they typically associate value with price and/or cost. This not only includes the price of the product, but also payment terms, transactions costs, cost to use, and other elements. However, value also includes many non-price/cost attributes as well. Value is also derived from how the product performs, including delivery, service, and support.
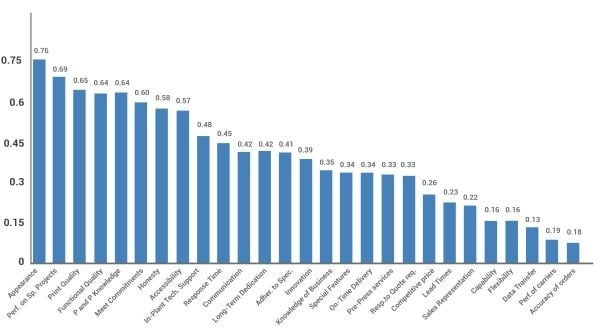
Determining the importance of each of these attributes in delivering value is necessary in creating a comprehensive understanding of value. Importance can be measured in two ways: stated and derived. Stated is just that — customers are asked to indicate on a rating scale the importance of each attribute. Through this method, all attributes tend to be rated toward the high end of the scale because nobody wants to risk the devaluation of a specific attribute.
The other way to measure value is to derive it. With this method, ratings of each attribute are compared to ratings of an overall value. A high correlation indicates a strong relationship between rating of the individual attribute and the overall value. Below is an example chart showing derived importance for a list of attributes. For a larger image, click here.
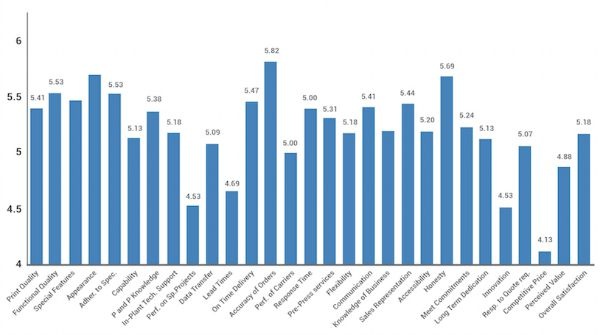
Measuring Performance
Measuring performance is a fairly straightforward data gathering process. Customers are asked to rate your company’s performance on various attributes. In this example, we used a 1-7 point scale with one indicating complete dissatisfaction and seven indicating complete satisfaction. Click the following link to view a larger image of Figure 2. This chart helps to identify areas of relative strength and weakness. It is important to note the word “relative” as this data does not yet recognize competition. These performance ratings also do not include importance. We know from Figure 1 that all of these attributes are not of equal importance.
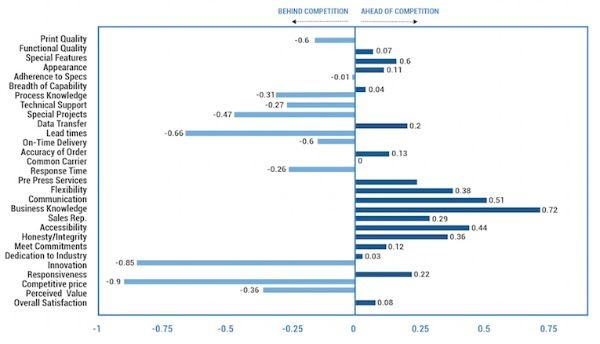
Competitive Position
Competitive position can be determined through the use of the best alternate supplier or BAS. Each respondent is asked to rate the performance of your company and are also asked to rate their best alternate supplier on the same attribute. BAS is defined as the one supplier that the respondent would choose if they did not buy from your company. This creates a best-in-class competitor that does not actually exist but defines the benchmark for the customer survey sample. By asking each customer to identify their choice of BAS, you can also develop competitor-specific competitive ratings. Figure 3 shows the difference in performance of the BAS verses your company. Attributes where your company’s performance is behind competition are represented with light blue bar, while dark blue bars indicate performance ahead of competition. To view a larger image of Figure 3, click here.
Growing Market Share
In general, the company offering a higher value will always win. In an open market with full information, customers will gravitate toward the highest value. There are of course some limitations to that axiom such as geographic or freight restrictions, trade tariffs, and other import/export market controls, sole supplier restrictions, and others. Any measurement of value must include competition — whether direct or indirect. Customers always make a trade-off trying to get the best deal. Usually the trade-off is between direct competitors. If a direct competitor is not available, the best alternate may be self-manufacture, a substitute product, or even a new source that the customer will develop. As such, trade-offs need to be incorporated into a value measurement program.
In Figure 4, the value position of a company can be visually represented by mapping derived importance value against competitive position. Click the following link for a larger image.
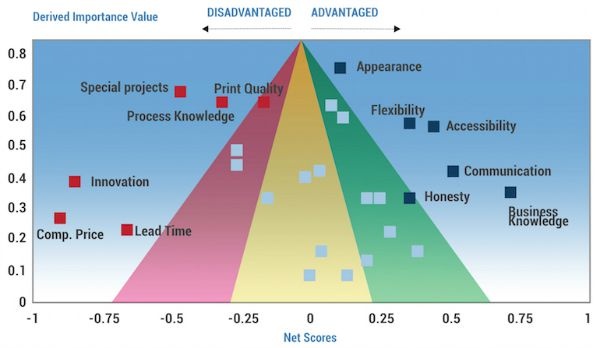
Attributes in the upper right represent those in which the company has the value advantage. Attributes in the upper left are those that are detracting from the company’s value position. The triangle in the center is the zone of uncertainty or parity where the competitive position cannot be determined with statistical confidence. In this example, value is being created and enhanced by flexibility, accessibility of key people, communication, and business knowledge — all dealing with the professionalism of their sales and support staff. They are losing value through performance behind competition in special projects, process knowledge, and innovation — suggesting that while the people may be flexible in their thinking, the company’s ability to execute an innovative solution is lacking. A value map allows the targeting of improvement efforts to those attributes that will most impact overall value. In turn, delivering superior performance relative to competition in the areas that create value will improve your competitive position and ensure your ability to increase market share.
To learn more about using market research for market positioning and increasing market share, check out our free eBook.

Editor's Note
This post was written by Priority Metrics Group (PMG), a MarketResearch.com partner in custom research.
About PMG
Priority Metrics Group (PMG) is a professional marketing consulting firm based in Spartanburg, South Carolina. PMG provides customized research, analysis, and consultation services designed to generate profitable growth for clients. They work with leading organizations in a variety of manufacturing and service industries. They are experts at gathering and processing market information, analyzing data, and translating information into actionable growth initiatives.