In our data-driven age, are you searching for ways to present your story in a concise way? With more quantitative or qualitative data than ever, the ability to visualize your insights effectively is a critical skill.
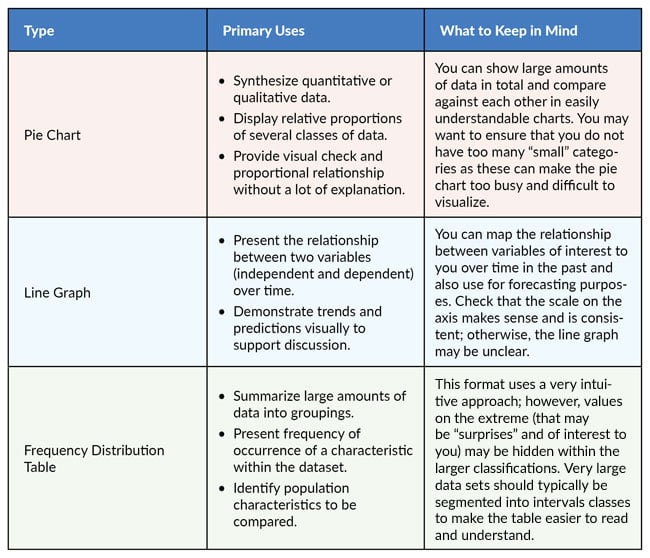
We’re here to help you summarize and display information in a clear, understandable format. When presenting data analyses, you have the choice of bar and pie charts, line graphs, and frequency distribution tables, just to name a few. The table below explains these three types of data presentation styles and includes some tips to help you make the most of each format.
The phrase “a picture speaks a thousand words” is very apt when it comes to data presentation styles. To demonstrate how different visual aids can be used in practice, this blog post provides some specific examples of Freedonia Custom Research’s (“Freedonia”) data presentation for custom clients. Freedonia has conducted hundreds of complex studies for many of the largest industrial companies in the world, and we know firsthand just how important effective data visualization can be for strategic decision-making. Please note that the tables and charts included below have been sanitized to protect the confidentiality of our clients' data.
Example 1:
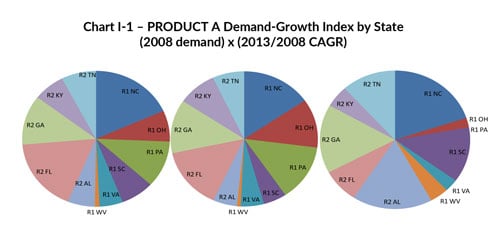
The Project: For a client seeking data and analysis to inform its decision concerning whether to invest in additional production capacity to serve a particular geographic area — Freedonia provided a succinct presentation of multiple data points in quick visual:
- US state-level demand for each in-scope product
- Forecasted compounding annual growth rate by state for each in-scope product
The Result: The comparison provided the client with the ability to quickly review the research to inform where and why to add production capacity.
Example 2:
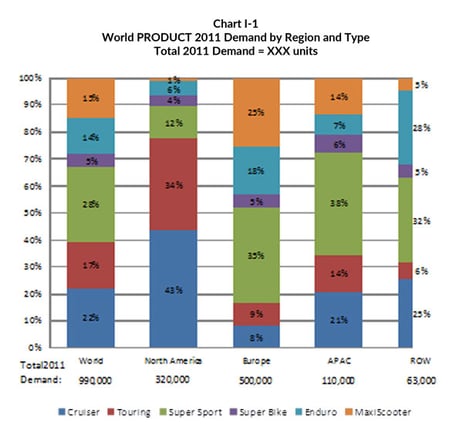
The Project: For an international manufacturer of motorcycles seeking to evaluate optimal opportunities for growth, Freedonia provided a detailed presentation including multiple data points in a quick visual:
- Comparison of demand for different product types
- Global and regional total demand and product-level demand in each geographic region
The Result: The ability to compare regions and product types to portray “materiality” of regions and product types to inform strategic decision-making.
Example 3:
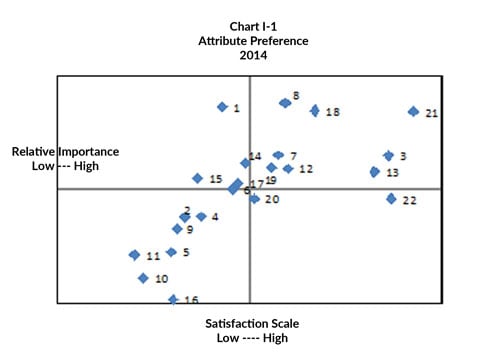
The Project: For a client in the cleaning product industry seeking to reposition its brand, Freedonia presented a simple portrayal of complex relationships between relative importance and existing satisfaction for a series of attributes. The table blending multiple data points and relationships included:
- Large number of data points plotted to position
- Comparison of importance and satisfaction of many attributes
The Result: The ability for the client to visually map strategic goals based on insights into importance as well as positioning to optimize strategic initiatives to improve its brand reputation.
How Freedonia Custom Research Can Help You
Questions about your specific data and presentation needs? Whether you are interested in custom research analysis associated with mergers and acquisitions, entry into new markets, or investment decisions, Freedonia Custom Research is uniquely positioned to help you obtain in-depth data accurately depicted through clear visualizations.
We have access to The Freedonia’s Group catalog of 3,300 industry studies, Kalorama and Packaged Facts, and 600 Focus Reports, giving us a significant head start on secondary data collection in terms of market size, growth rates, and competitor information. That’s information we can begin to validate and refine in the course of primary research, and because many industry participants are familiar with Freedonia’s research, they’re eager to talk with us about their business.
Not only do we know where and how to find all the data needed for a successful research project, we know how to bring it all together so that an abundance of data points is transformed into actionable insights that is communicated accurately and succinctly for your business. We cross-check pieces of information against one another to identify both trends and outliers, ensuring you get a complete and accurate picture of the industry whatever presentation style you require.
If you’d like to learn more about how Freedonia Custom Research can help you present simple and complex data, please contact Alison Wolf, Director of Client Solutions at 440-684-9600.

About the Author: Alison Wolf is the Director of Client Solutions at Freedonia Custom Research, a subsidary of The Freedonia group, which delivers targeted market research for the exclusive use of the requesting client.