Your Movable Middles is the most important segment of category buyers for your brand you might not have heard of yet. They are proved by math and supported by in-market evidence to deliver FIVE TIMES the ROAS (return on ad spending) of all other category buyers.
Consumers are in the Movable Middle if they have a probability of choosing your brand that is between 20-80%. It is proven by the MMA and Neustar that shifting funds towards targetable audiences that are rich in their concentration of Movable Middles raises ROAS by 50% AND increases conversion of non-buyers by 13%.
Low Unresponsives do not respond much to your advertising typically. However, that is where the great majority of non-buyers of your brand reside so with the right creative, you might have some success with a conquesting campaign.
Figure 1 illustrates how the size of these segments are expected to systematically vary and their relative responsiveness to advertising. The size of the ball represents the percent of category buyers in that brand preference group. The “incline of the hill” represents how easy or hard it is to get them to respond to your advertising
Figure 1
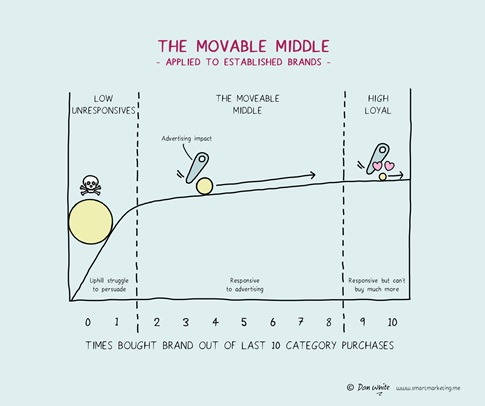
This provides a powerful and understandable framework for the marketer’s dilemma: how do I best execute and balance performance vs. brand marketing? Think of it this way—performance marketing is about directing your ad impressions to the Movable Middle for the biggest sales bump by reminding consumers of what they already know about the brand. Brand marketing is about moving Low Unresponsives to become Movable Middles. This challenge requires that your advertising leads them to think or feel something new about your brand.
And this is the focus of this article: WHAT do you want “converts” to know or feel? What are the distinctive beliefs needed for conquest of non-buyers to “make” them into a “Movable Middle” consumer?
So what do we know about the Movable Middle? About the low unresponsives? About your most loyal buyers? How can we develop predictive models to classify consumers? That is where Discriminant Analysis from brand tracking or brand equity studies comes in.
This technique can be particularly effective to lay out a road map to guide customers from Low Unresponsives to Movable Middle, and then hopefully to High Loyals.
The analysis is called Comparative Discriminant Analysis, and this piece will give a simple, step-by-step template using a fictional Coca-Cola brand iced tea—Bok Tea—as a case study. The iced tea category is large and lucrative, but the brand is underperforming. The brand team should want to migrate consumers from Low Loyals to Movable Middles (and eventually High Loyals) in order to achieve sustainable growth.
If Coca-Cola could move folks to the Movable Middle of Bok Tea, it will lead to the double win of greater sustained market share AND greater advertising responsiveness/profitability. When advertising is practically self-funding, it leads to higher budgets and even more growth… a virtuous cycle of brand growth!
Basics of Discriminant Analysis
Discriminant analysis is a priori statistical technique—that is, the groups or dependent variables are pre-defined (what data scientists might call “supervised learning”). Our preference is using constant sum questions across a consideration set although other survey approaches can work as well. The goal is to develop a probability of purchase estimate towards your brand for each survey respondent given a category purchase. The first requirement, then, are the groups. You need to have the groups defined. Multiple discriminant analysis, from which discriminant maps are drawn, then gives the distinguishing characteristics.
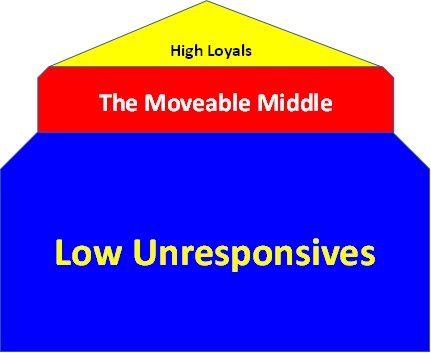
Characteristics of the grouping variable are simple. They are distinct, mutually exclusive, and exhaustive. In the case of Bok Tea, we are looking within each level of the loyal pyramid to define membership groups.
Figure 2 – Bok Tea Movable Middle Pyramid
Construction of the Target Variables
The target, or dependent variables, are constructed like this. For the first discriminant level, we begin with our sample. For a Movable Middle analysis, all respondents in the survey have to buy the category. We found 10,000 category buyers to sample. As we move up the pyramid, the sample size of the analysis shrinks to those customers who are in the next level—or higher.
The chart below illustrates the dependent variables and their respective sample sizes.
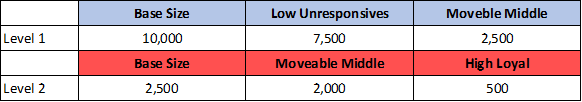
As we can see, the base sizes shrink as we ascend the pyramid. In the first level, those who are Aware but are Bok Tea Low Unresponsives a ‘0’. Those who are Bok Tea Movable Middle or High Loyals are coded a ‘1’.
Creation of the Dependent Variables—The Road Map
What gives the comparative discriminant analysis such power is its ability to use many parts of the survey to determine what motives customers to move up the brand pyramid. And for each level, we are looking at, essentially, a new analysis. This is a roadmap that gives not one set of directions, but (in our case), four.
It is not unusual to use six or seven different sections of the survey in a roadmap analysis. However, to illustrate things we will simplify our analysis for Bok Tea and keep it to four brand arrays.
For Bok Tea, we are going to look at the following survey sections to determine how to move up the brand pyramid.
- Primary reasons for purchasing iced tea (brand non-specific)
- Favorite Bok Tea flavors
- Rating the Bok Tea brand
- Negative statements about Bok Tea—brand barriers
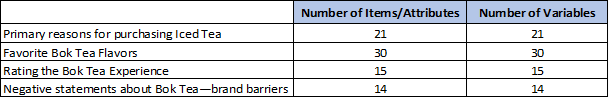
On the Bok Tea quarterly tracker, Bok Tea asks respondents 21 primary reasons they purchase any brand of iced tea. Bok Tea is testing 30 flavors. Respondents are then asked to rate Bok Tea on 15 Bok Tea statements. Finally, respondents are asked if Bok Tea is expected to deliver any of 14 negative experiences.
The chart (below) shows how, for each item, performance rating, and barrier we are creating a new variable. These variables are coded 1/0. If one ordered an item, that item variable gets a 1, if not, a 0. If a respondent agrees with a statement about Bok Tea, the variable gets a 1, otherwise a 0. If a barrier, a 0, otherwise a 1. The variables created are summarized, below.
There are four categories shown above. Thus, we run four discriminant analyses for each level of the brand pyramid. That is, we are running 12 analyses in total.
Interpreting the Analysis
This technique is labeled a comparative discriminant analysis due to the fact that we run the same analysis for all levels of the brand pyramid. The one aspect that changes is the dependent variable. In this way, we are able to say which items, which performance, and what barriers drive the respondent from one when level to the next. We are, in effect, creating a roadmap to grow the Bok Tea brand.
To display the output for each level of the analysis would take up too much room. Below is an example of how the discriminant analysis statistical output might look.
The highlights are the Bok Tea Attributes they do well that most discriminate between the Low Unresponsives and Movable Middle.
Rating the Bok Tea Experience – Unresponsives to Movable Middle
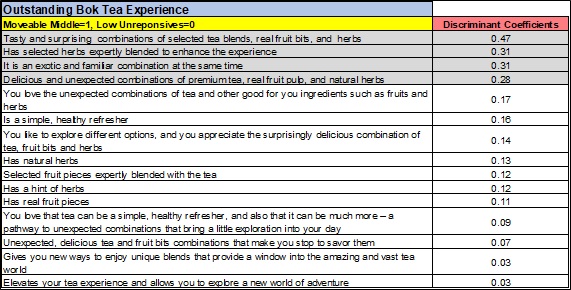
The simple interpretation of this charts is that the top 4 attributes discriminate the most between customers who are Movable Middle of Bok Tea and those who are Low Unresponsives.
Summarizing the Brand Path
The final step in this analysis is to summarize the discriminators across the four survey areas we used in the comparative discriminant analyses. We are showing, below, the discriminators between Movable Middle and Low Unresponsives.
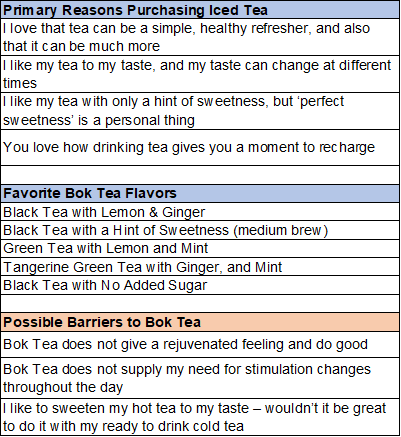
From this summarized chart we know iced tea purchase drivers, favorite flavors, Bok Tea attributes and possible barriers to guide consumers to the next level of Bok Tea brand pyramid. Remember, with this analysis we provide four of these summary tables, one for each path of the brand pyramid.
Comparative discriminant analysis is one of several useful, agile methods that have been around since the invention of mathematics yet stay current in today’s branding strategy methods. Applied to the Movable Middle you have a powerful analysis that can guide advertising communication and innovation efforts that will deliver short term performance and long-term brand growth.
Editor's Note
Michael Lieberman is founder and president of Multivariate Solutions, a statistical and marketing research consulting company based in New York. He can be reached at 1.646.257.3794, or at michael@mvsolution.com.
Joel Rubinson is founder of Rubinson partners, Inc. He functions as the advanced analytics expert for the MMA trade association as well as serving other clients and is the former Chief Research Officer of the ARF. He can be reached at joel@rubinsonpartners.com